Analyzing Target Performance
When you have multiple targets in rotation, analyzing individual target performance is crucial for optimization. ClickerVolt tracks detailed metrics for each target, allowing you to identify winners and eliminate losers.
Accessing Target Statistics
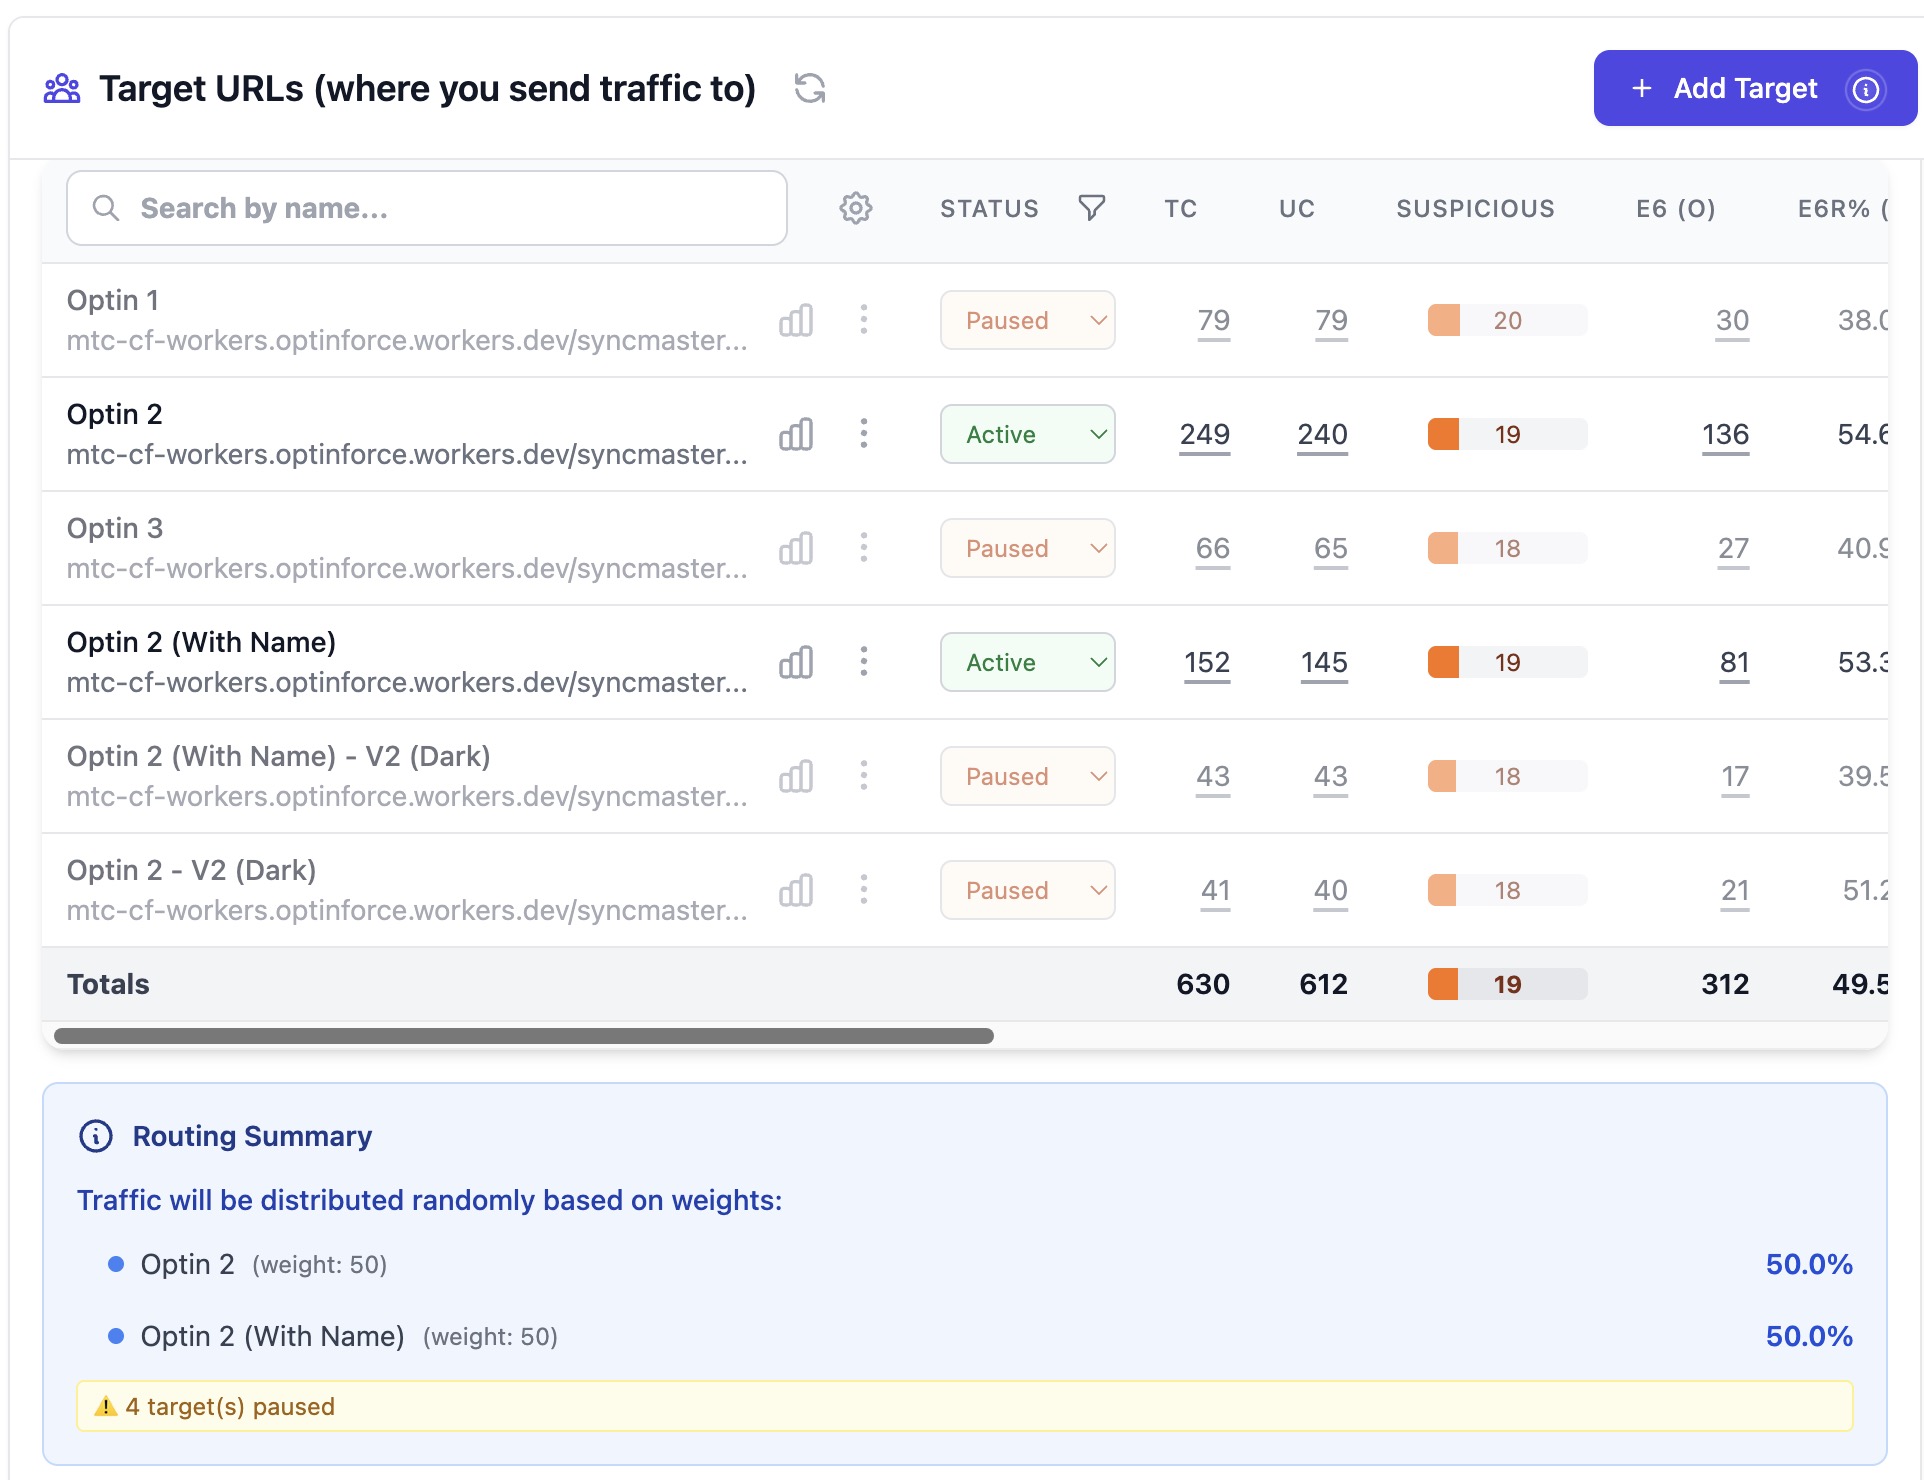
From your main statistics dashboard, click on any link name to view its target breakdown. You'll see a table showing performance metrics for each target URL in that link's rotation.
Target-Level Metrics
Each target displays:
- Target URL and name
- Clicks received
- Conversions generated
- Conversion rate
- Revenue and profit (if tracking)
- Distribution percentage (actual traffic share)
Identifying Top Performers
Look for targets with:
- Higher conversion rates than average
- Positive ROI when cost tracking is enabled
- Consistent performance over time
- Strong performance across different traffic sources
Sort by conversion rate or ROI to quickly identify your best-performing targets.
A/B Testing Strategy
Effective A/B testing workflow:
- Start with equal weights for all targets (50/50 for 2 targets, 33/33/33 for 3 targets)
- Run until each target has at least 100-200 clicks
- Analyze conversion rates - look for clear winners (at least 20% higher CR)
- Adjust weights to send more traffic to winners, less to losers
- Continue iterating - optimization is an ongoing process
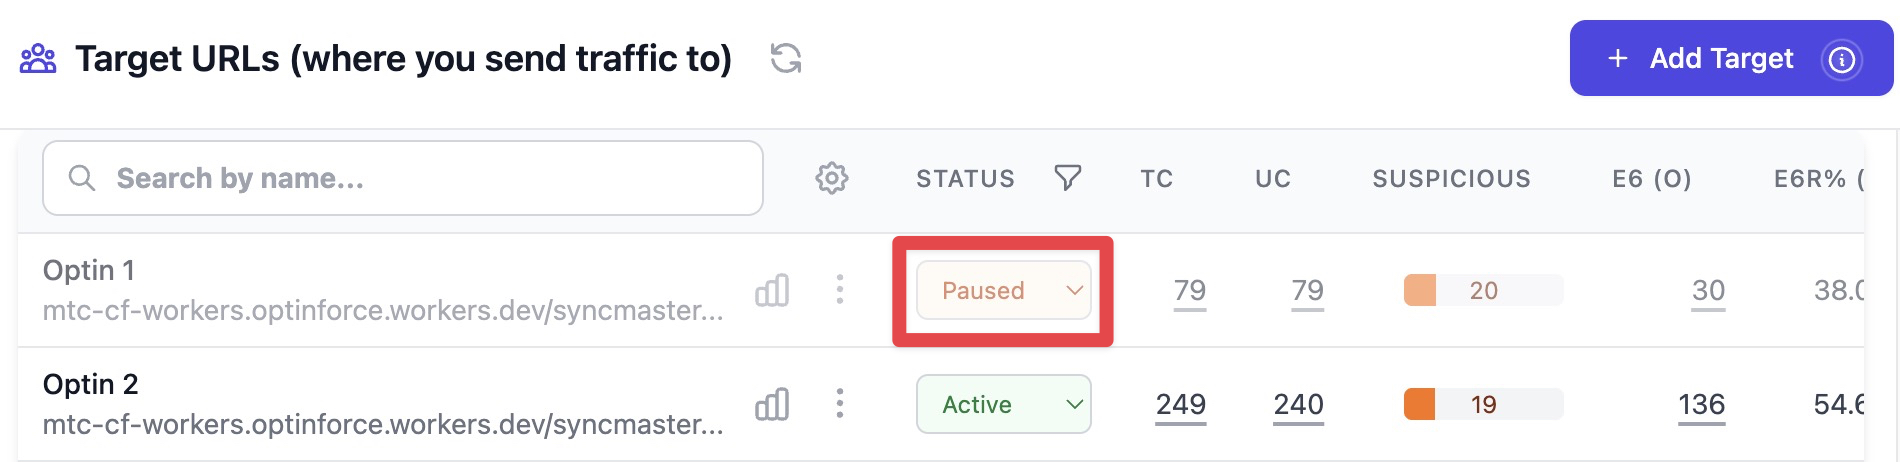
When to Pause or Remove Targets
Consider removing a target when:
- Conversion rate is consistently 50% lower than the best performer
- ROI is negative after sufficient data (500+ clicks)
- The target is broken or leads to errors
- The offer has been discontinued or changed
Pausing underperformers focuses traffic on your best targets, increasing overall campaign profitability.
Comparing Targets Across Metrics
Don't just look at conversion rate. Consider:
- Revenue per conversion - some targets may convert less but at higher value
- Profit per click - the ultimate metric combining CR and revenue
- Custom events - which targets drive more engaged users?
- Temporal patterns - does performance vary by day or time?
Advanced Topics
Statistical Significance Testing
Use the 100-200 click minimum as a baseline, but for marginal differences (less than 10% CR difference), you may need 500+ clicks per target to be confident the difference is real and not random chance.
Multi-Variate Testing
Test one variable at a time (landing page, headline, offer, etc.). If you test multiple elements simultaneously across different targets, you won't know which element caused performance differences.
Seasonal and Temporal Effects
Target performance can vary by day of week, time of day, or season. Check "Raw Events" to see if certain targets perform better at specific times, and consider using multiple links with different schedules.
Traffic Source Segmentation
Different traffic sources may respond differently to the same targets. Create separate tracking links for each traffic source to isolate these effects and optimize accordingly.
Progressive Optimization
Don't eliminate losers too quickly. Sometimes targets need more data to reveal their true performance, especially with small sample sizes or high variance in conversion values.