Understanding Your Statistics
The statistics dashboard is your command center for analyzing campaign performance. It displays comprehensive data about clicks, conversions, costs, and revenue for all your tracking links.
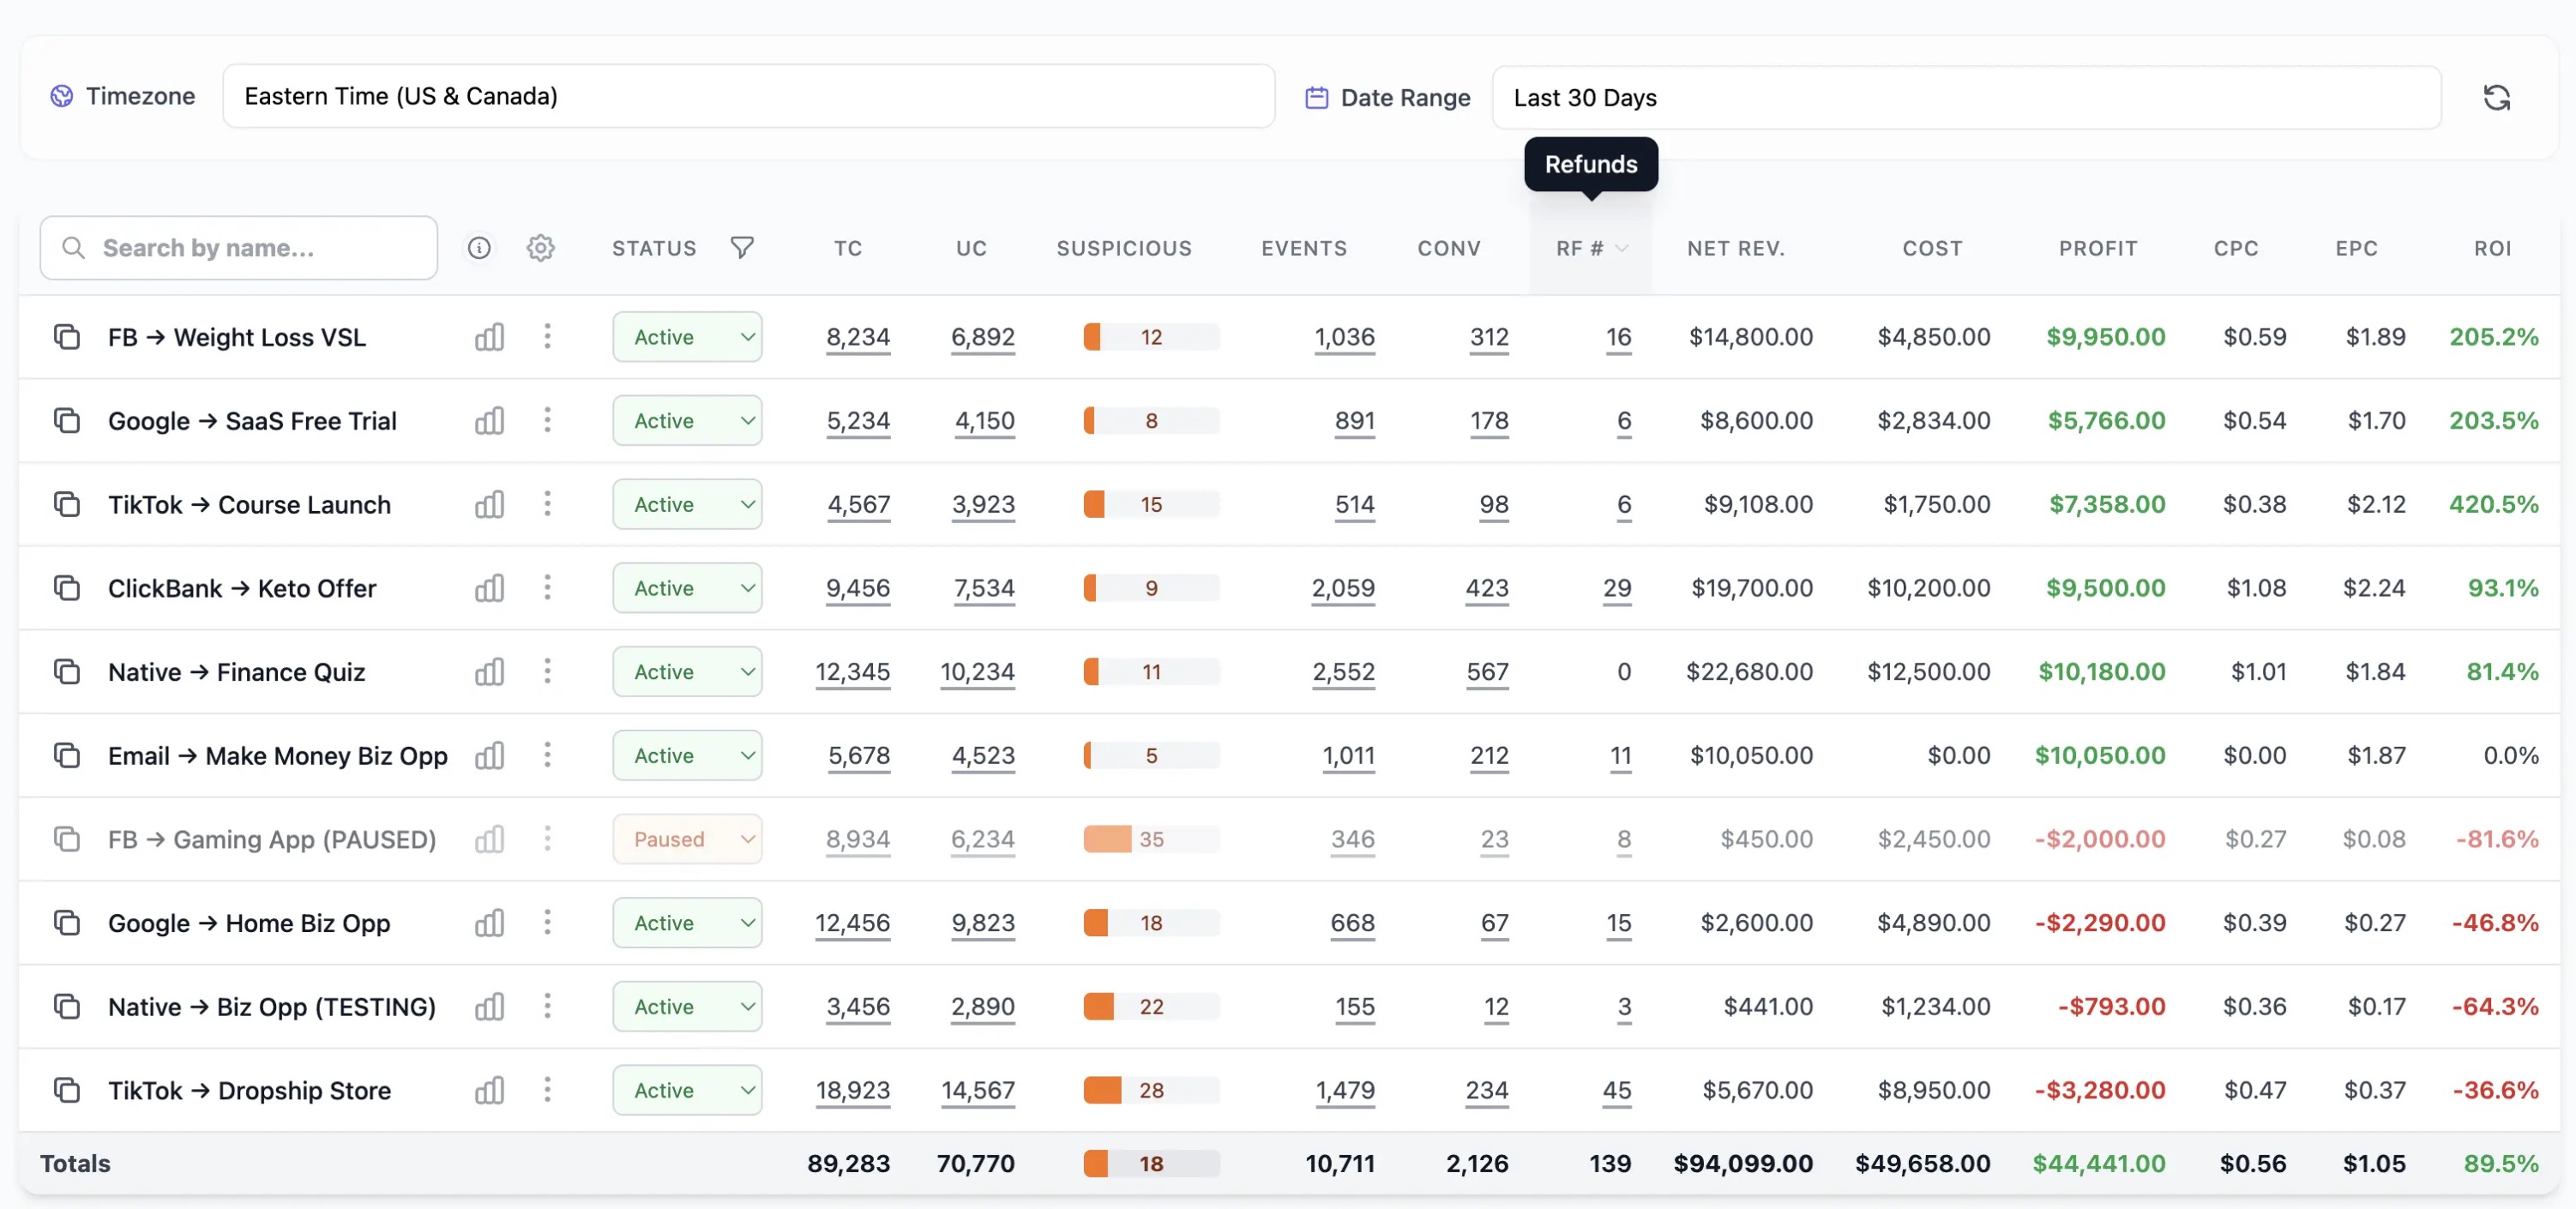
Key Metrics Explained
Total Clicks (TC)
Total number of times your tracking link was clicked. Each click represents a visitor who was redirected through your link to a target URL.
Unique Clicks (UC)
Number of distinct visitors who clicked your link. ClickerVolt uses advanced visitor identification combining cookies, browser fingerprinting, and IP analysis to accurately count uniques even across devices and sessions.
Conversions (CONV)
Number of visitors who completed your main conversion goal. Tracked via JavaScript (first-party), S2S Postback (60+ networks), or IPN (ClickBank, WarriorPlus, Explodely) depending on your setup.
Cost
Total amount spent on traffic for this link. Tracked by adding cost parameters to your tracking URL or using traffic source cost tokens.
Revenue (NET REV.)
Total net revenue after refunds generated from conversions. For JavaScript tracking, revenue is configured when setting up the conversion script (static value or JavaScript variable). For affiliate networks, revenue is automatically sent via IPN or S2S postback.
Profit
Revenue minus Cost. This is your net profit after advertising expenses. Positive profit means the campaign is profitable.
ROI (Return on Investment)
Profitability percentage calculated as: (Profit ÷ Cost) × 100. An ROI of 100% means you doubled your money. Negative ROI means the campaign lost money.
EPC (Earnings Per Click)
Average revenue per click, calculated as: Revenue ÷ Clicks. Useful for comparing campaign efficiency regardless of traffic volume.
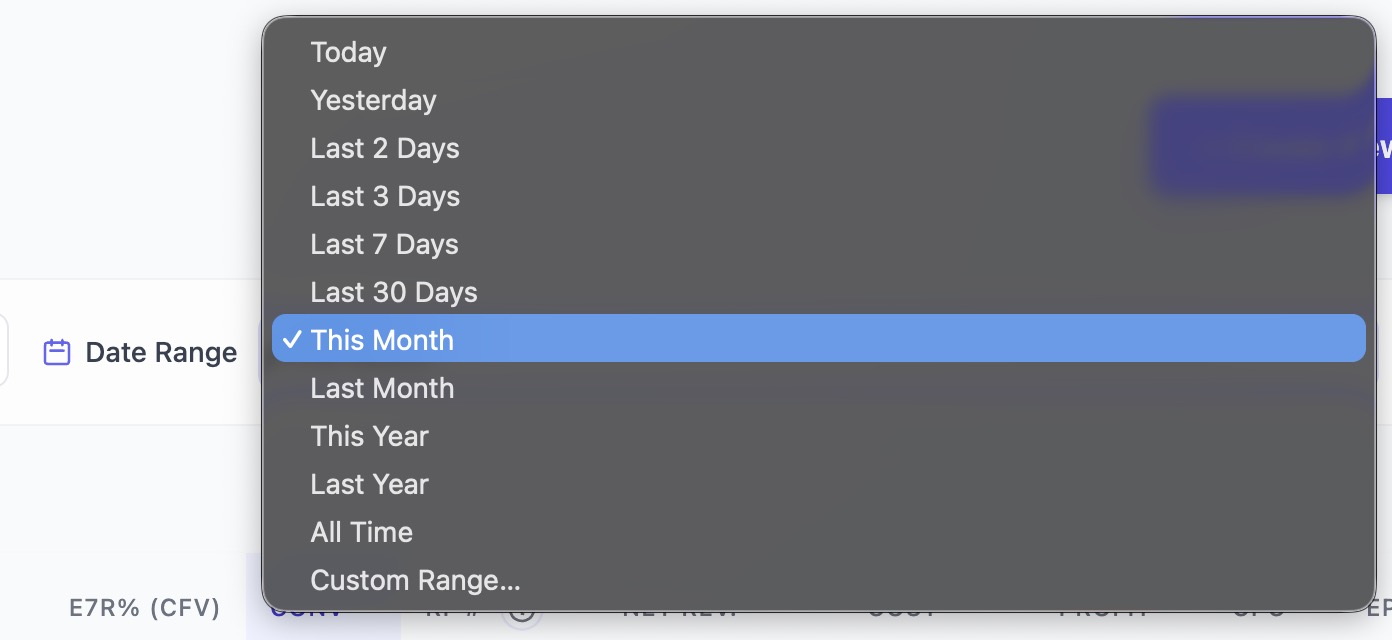
Using Filters
The filter panel lets you narrow down your statistics to specific time periods, campaigns, or traffic sources.
Date Range Filtering
- Today: Current day's data
- Yesterday: Previous day
- Last 7 days: Rolling week
- Last 30 days: Rolling month
- Custom range: Select specific start and end dates
Link Filtering
Search and filter by link name or slug to focus on specific campaigns. Use this to compare performance across different offers or traffic sources.
Status Filtering
Filter by link status: Active, Paused, or Archived. Hide paused links to focus on currently running campaigns.
Sorting and Analysis
Click any column header to sort by that metric. Click again to reverse the sort order. Common sorting strategies:
- Sort by Clicks (descending) to see highest-traffic campaigns
- Sort by ROI (descending) to identify most profitable campaigns
- Sort by Profit to see which campaigns generate most revenue
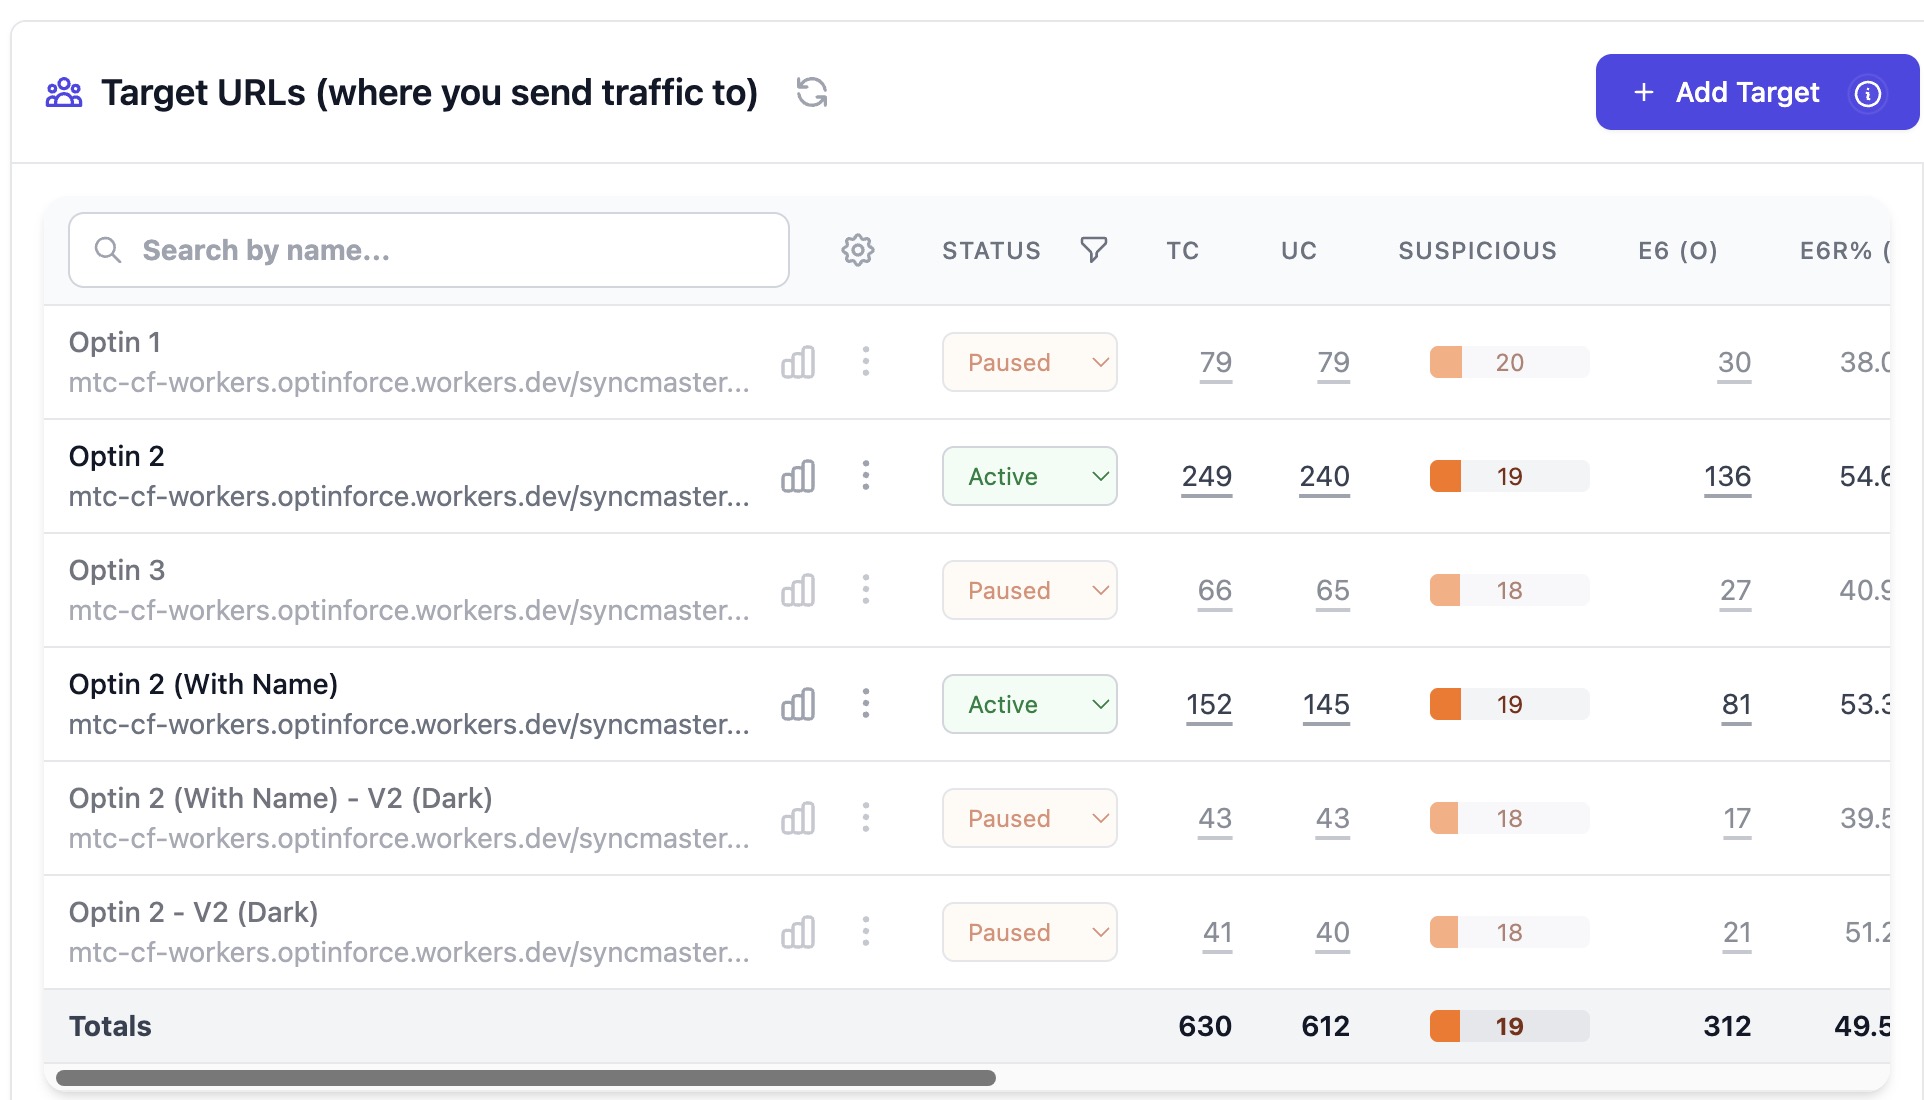
Target-Level Statistics
Click on any link to view target-level breakdowns. This shows performance for each individual target URL within the link, allowing you to identify which targets perform best in your rotation.
Advanced Topics
Statistical Significance
Don't make decisions based on small sample sizes. Wait for at least 100-200 clicks per target before declaring a winner in A/B tests. Small samples can show misleading results due to random variance. For conversion rate testing, aim for at least 30-50 conversions per target before making confident optimization decisions.
Custom Events in Statistics
If you're using custom event tracking (Events 1-10), these appear as additional columns in the statistics table (E1, E2, ... E10, plus Total Events). Each event shows the count of times that event was triggered. Custom names appear as "Custom Name (E1)" if configured. Events do not track revenue - only conversion counts.
Raw Events View
Access individual click and conversion events to see granular visitor-level data including device info, location, timestamps, and referrers. This detailed view helps with debugging tracking issues and understanding visitor behavior patterns.
Data Freshness
Statistics are updated in real-time for JavaScript conversions (within seconds) and near real-time for affiliate network tracking via IPN or S2S postback (typically 1-5 minutes depending on network speed). Click data appears instantly as visitors are redirected.