Dashboard Overview
The ClickerVolt dashboard is your command center for managing tracking links, funnels, and analyzing campaign performance. This guide will help you understand every section and navigate efficiently.
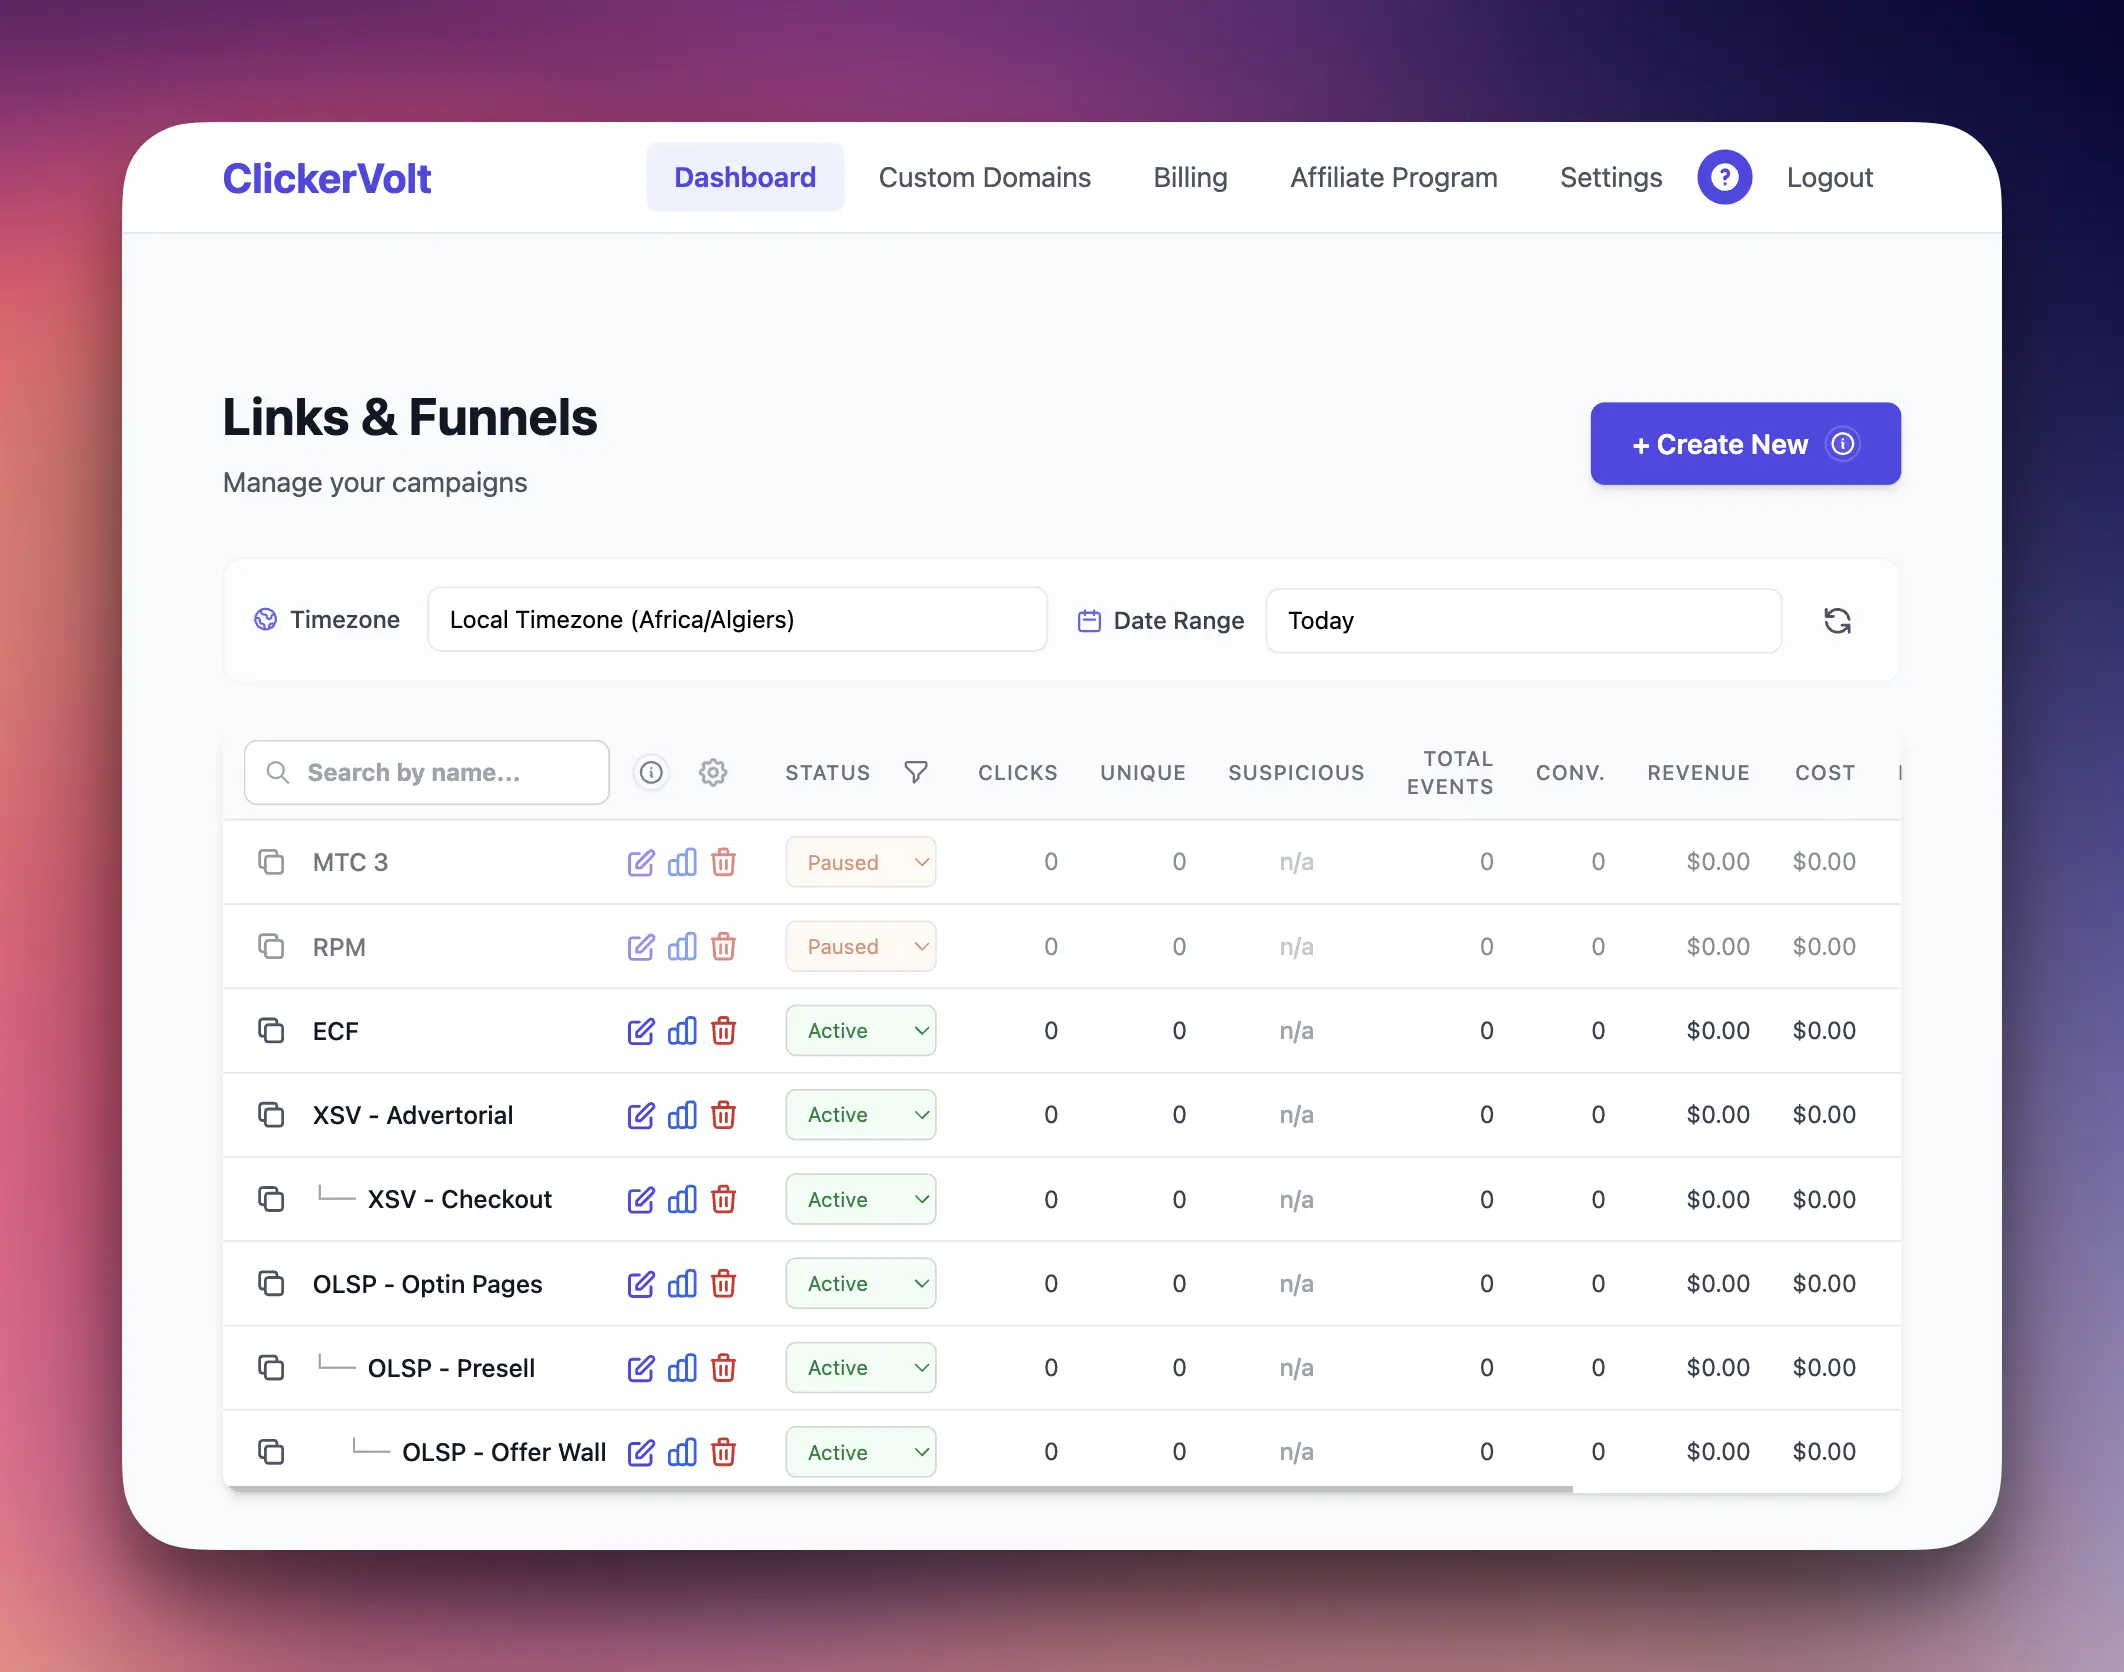
Main Dashboard Layout
The dashboard is organized into several key sections:
- Top Navigation Bar: Access settings, billing, custom domains, and help
- Action Buttons: Create new links
- Filters & Search: Filter and search through your links
- Statistics Table: View all your links with real-time performance data
Top Navigation Bar

The top navigation provides access to all major sections:
- Dashboard: Return to the main link list
- Billing: Manage credits, payment methods, and auto-reload
- Custom Domains: Add and configure custom tracking domains
- Affiliates: Access your referral program and commissions
- Settings: Update your profile, password, and preferences
- Help: Open the help panel (click the ? icon)
Action Buttons Section
New Link Button
The blue "New Link" button in the top right is your primary action button. Click it to open the link creation form where you can:
- Create a new tracking link
- Configure rotation algorithms
- Add multiple targets
- Set up geo-targeting
- Assign custom domains
Filters & Search Panel
Use the filters to narrow down your link list and find what you need quickly.
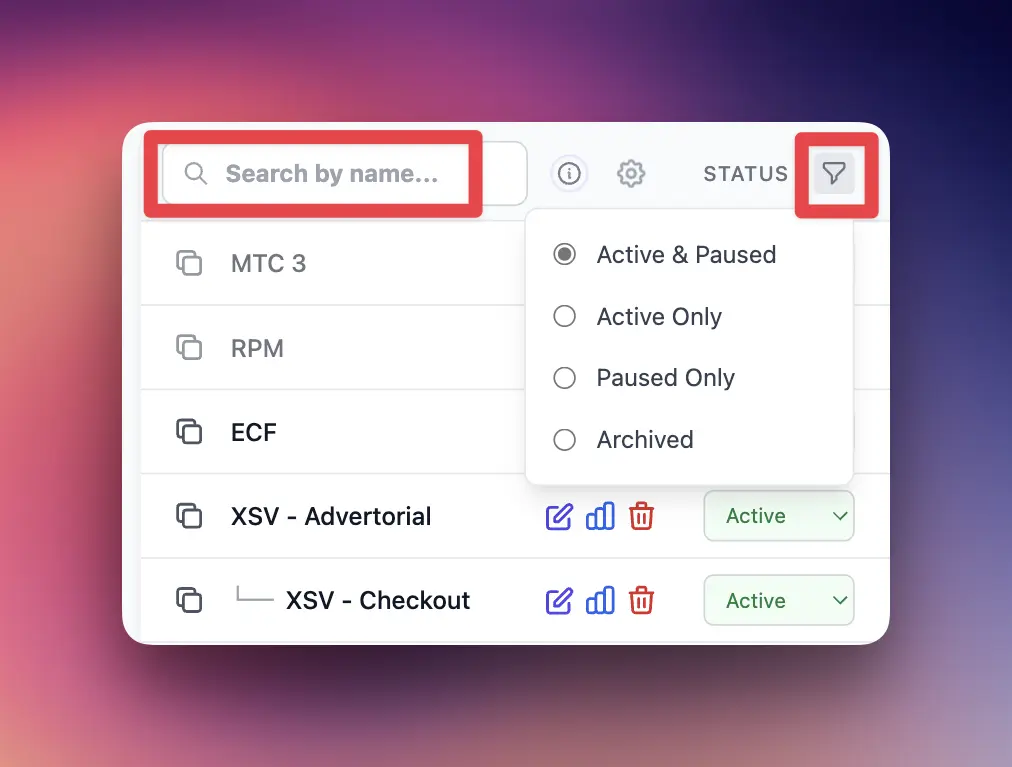
Status Filter
Filter links by their current status:
- Active & Paused: Show both active and paused links (default)
- Active Only: Only show links currently accepting traffic
- Paused Only: Only show temporarily disabled links
- Archived: Only show archived links
Search Box
Type into the search box to filter links by name or slug. The search is instant and case-insensitive.
Tip: Use descriptive names for your links to make searching easier later.
Time Period
Use the time range filters to analyze your statistics for a specific period.
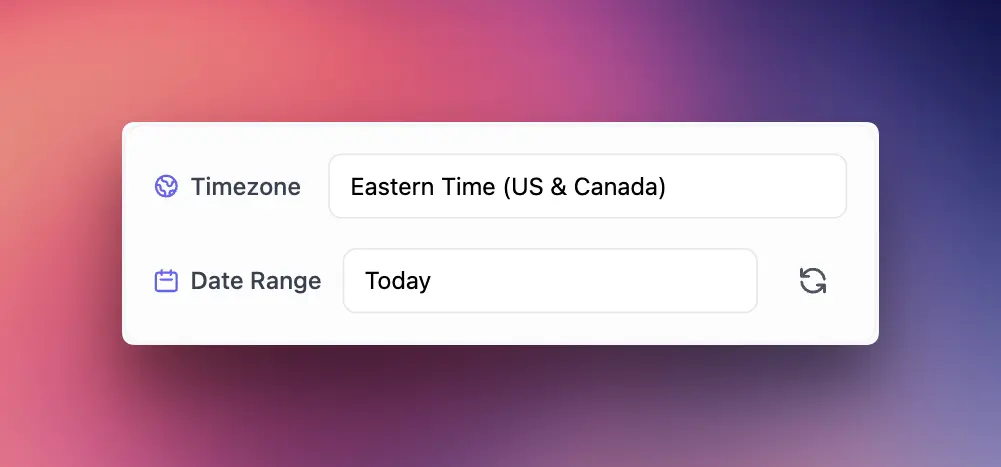
Timezone Selector
Select the timezone for displaying your statistics. By default, ClickerVolt uses your local browser timezone, but you can switch to any timezone worldwide to match your target audience or team location.
Date Range Filter
Select a date range to filter statistics shown in the table:
- Today
- Yesterday
- Last 2 Days
- Last 3 Days
- Last 7 Days
- Last 30 Days
- This Month
- Last Month
- This Year
- Last Year
- All Time
Note: Changing the date range only affects the statistics columns (clicks, conversions, etc.), not which links are displayed.
Statistics Table
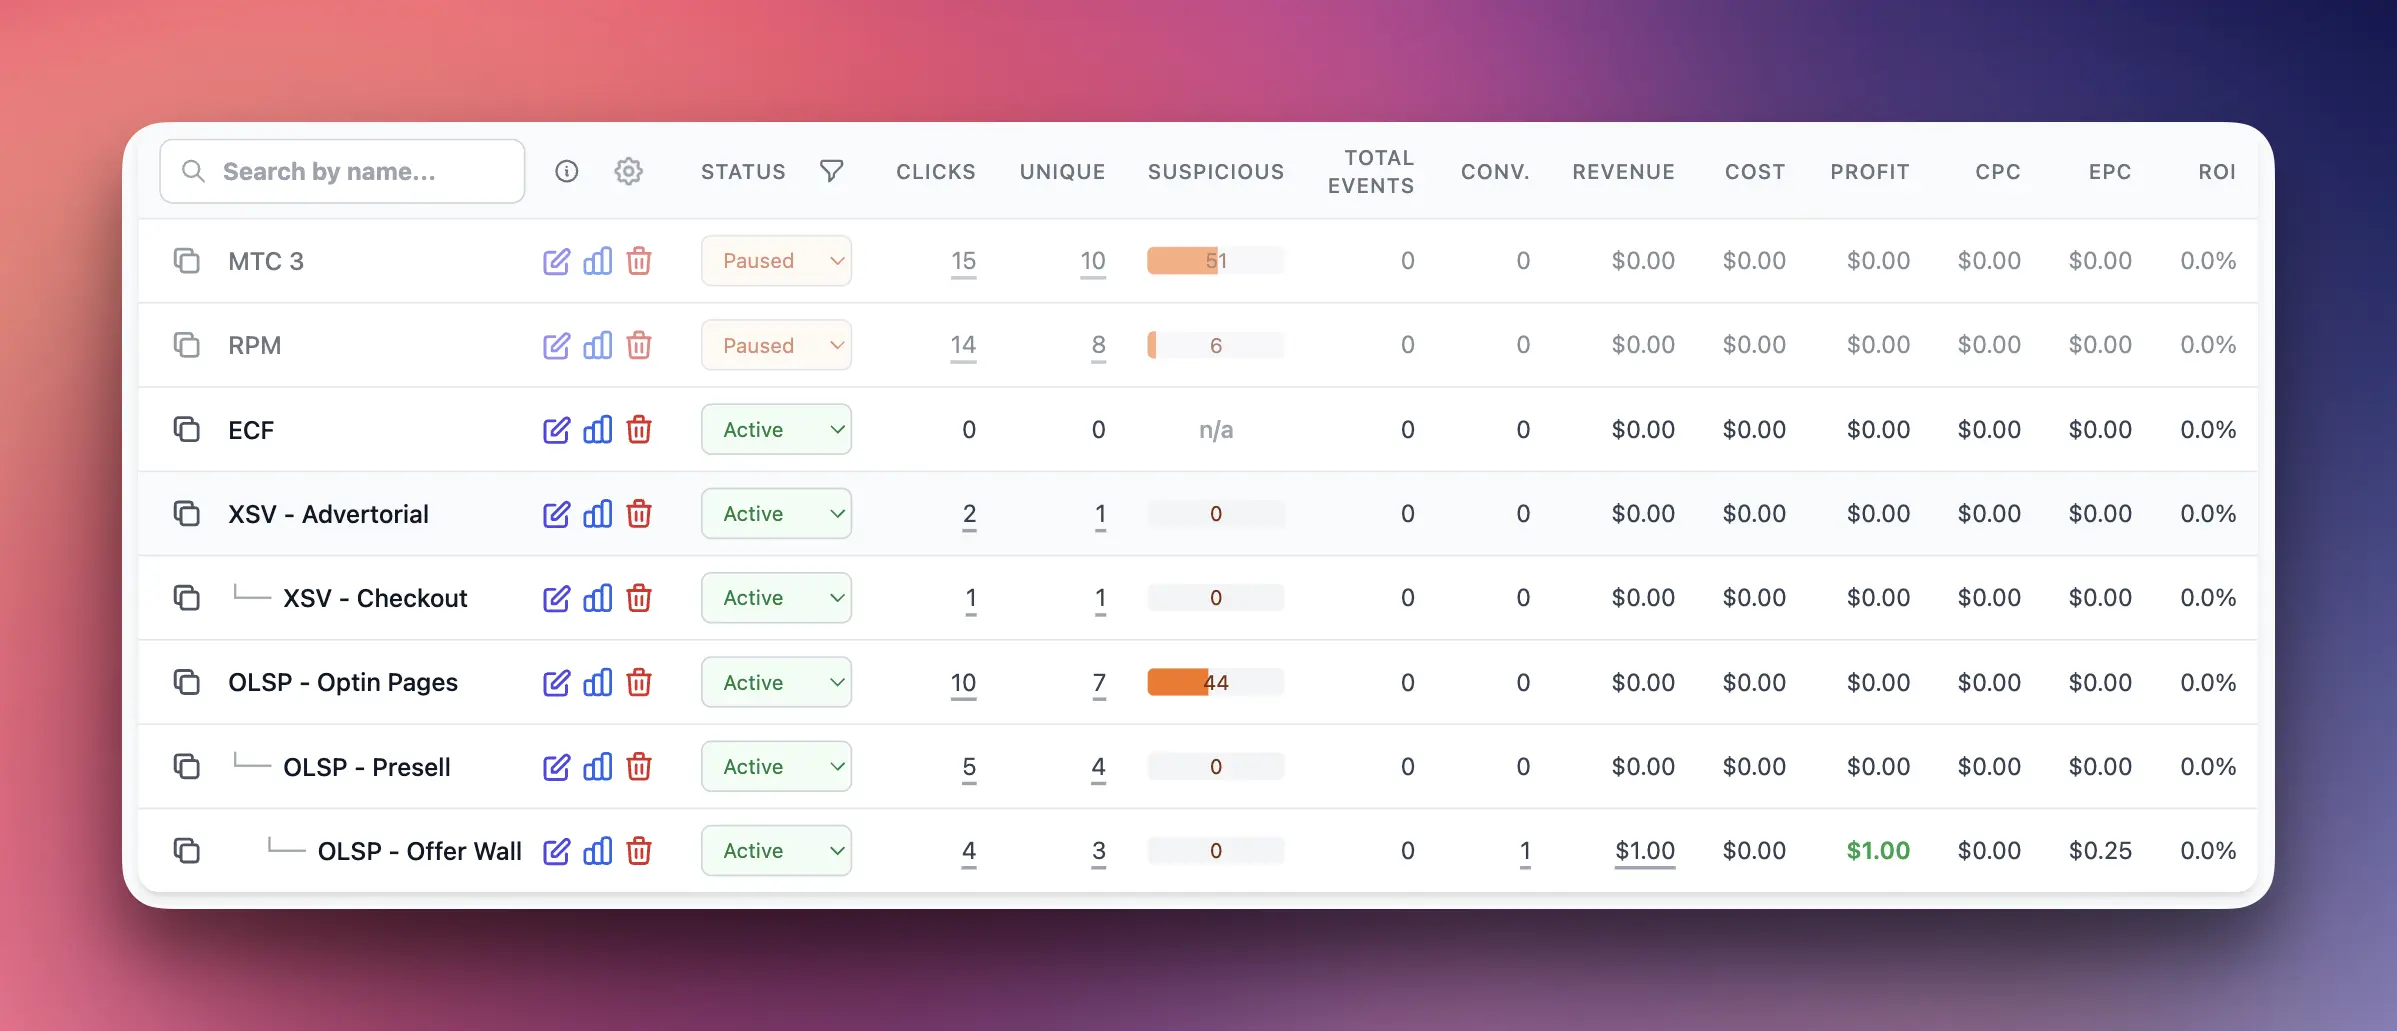
The main table shows all your tracking links with real-time performance metrics. Here's what each column means:
Link Name Column
The first column shows your link name with a copy icon button on the left. The table also displays funnel hierarchy using tree connectors when links are connected as parent-child relationships.
- Copy Icon: Click to copy the redirect URL to your clipboard
- Link Name: Shows the name you gave your link
- Tree Structure: Indented links with connectors (├──, └──) show parent-child funnel relationships
Actions Column
Quick action icons appear on the right side of each row:
- Edit: Opens the link edit form (pencil icon)
- Reports: Opens detailed reports for this link (chart icon)
- Delete: Permanently removes the link (trash icon)
Note: The copy button for the redirect URL is located on the left side of the link name, not in the actions column.
Status Column
Shows the current status of each link with an inline dropdown for quick status changes:
- Active: Link is live and accepting traffic
- Paused: Link is temporarily disabled
- Archived: Link is hidden from normal view (use status filter to view)
Click the status dropdown to instantly change a link's status without opening the edit form.
Clicks
Total number of clicks received in the selected date range. This includes both unique and repeat visitors.
Unique Clicks
Number of unique visitors (first-time clickers) in the selected date range for a specific link. ClickerVolt uses browser fingerprinting to accurately identify unique visitors.
Conversions
Total number of conversions tracked for this link. A conversion is a valuable action like a sale, signup, or lead.
Requires conversion tracking to be set up (see Conversion Tracking guides).
Conversion Rate (CVR)
Percentage of clicks that resulted in a conversion, calculated as:
CVR = (Conversions ÷ Clicks) × 100
Higher conversion rates indicate better campaign performance.
Revenue
Total revenue tracked for this link in the selected date range. Revenue is tracked automatically if you're using affiliate network integrations (ClickBank, JVZoo, etc.) or can be sent manually via the conversion tracking script.
ROI (Return on Investment)
Percentage return on your ad spend, calculated as:
ROI = ((Revenue - Cost) ÷ Cost) × 100
Note: ROI calculation requires tracking both revenue and costs. Revenue is tracked automatically through conversions. Costs can be tracked at the click level by adding a cost parameter to your tracking link URL (e.g., ?cost=0.50), or by using dynamic cost tokens from your traffic source, when available.
Understanding the Data
Real-Time Updates
Statistics are updated in near real-time, usually within 2-3 seconds of a click or conversion occurring. If you don't see data immediately, wait a moment and refresh the page.
Date Range Impact
Remember that changing the date range filter only affects the numbers shown in the statistics columns. It doesn't hide or show different links - use the status filter for that.
Empty States
No links yet: If you haven't created any links, you'll see a prompt to create your first link.
No clicks yet: Links with zero clicks will show "0" in the statistics columns.
No conversions: If conversion tracking isn't set up or no conversions have occurred, these columns will be empty or zero.
Advanced Topics
Sorting the Table
Click any column header to sort the table by that metric:
- Click once to sort ascending (lowest to highest)
- Click again to sort descending (highest to lowest)
- Click a third time to remove sorting
Sorting by clicks or conversions helps you quickly identify your best-performing links.